Marathon Update Release Dec 20, 2022
Highlights
Asset Engineering Performance Plots
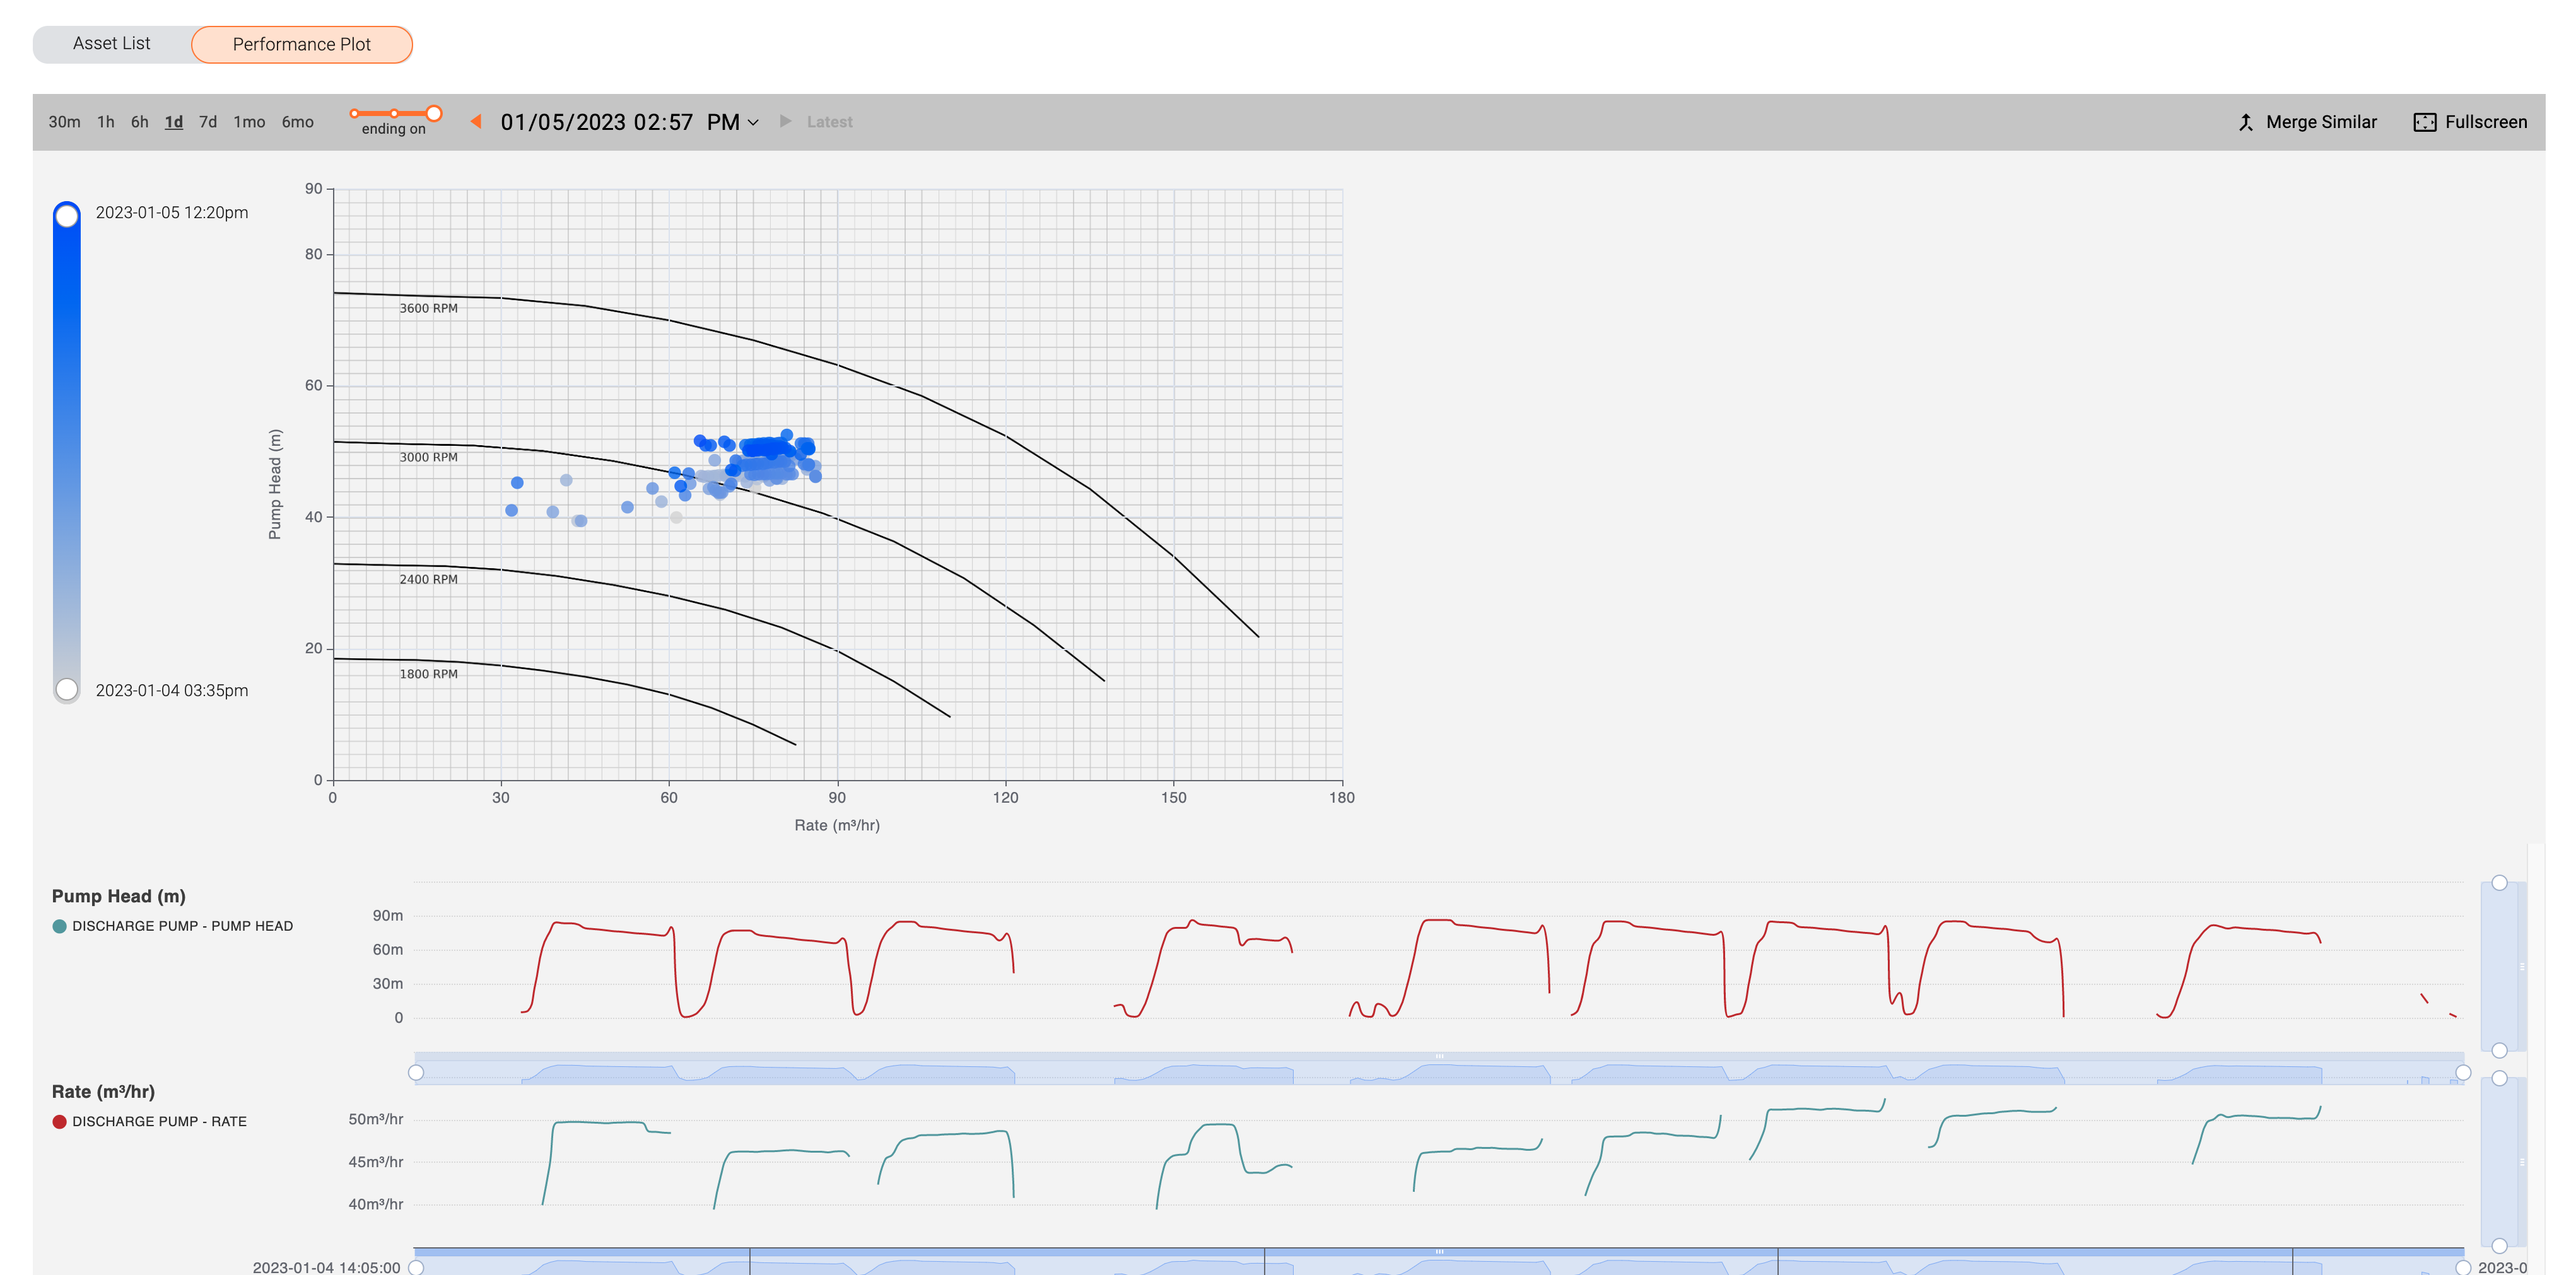
- Marathon now includes functionality to add asset performance plots, which overlay sensor data onto engineering performance diagrams.
- For example rate vs. head performance curves from pump manufacturers can be integrated to show operational data overlaid for those pumps.
- Users can navigate different time frames and resolutions for the data overlays using the existing Marathon time series navigation functionality.
Creating Comparisons from an Event
- A new compare button has been introduced in all event screens, which allows a user to prepopulate a compare screen with the sensors from that event.
- This allows users to drag and drop additional sensors from the asset tree to further customize which sensors are shown with the corresponding event.
- The event overlays are persisted in the generated compare screen.
Known Issues
- Generating a comparison from asset search or drag and drop will produce a data loading error if that action causes the application to attempt to render approximately 130 or more time-series charts simultaneously.
- List of prior maintenance records displayed below a failure record may not always correspond directly to the asset of the failure record. A workaround is to be on the specific asset you are exploring the failure event for.
- In full-screen mode, the time-series charts are occasionally not resized to full height.
Upgrade Instructions
- Marathon updates automatically, so no manual steps are required.
Last update: April 11, 2024