Event Analysis

The Events Analysis tab enables to analyze event types by asset over a designated period of time.
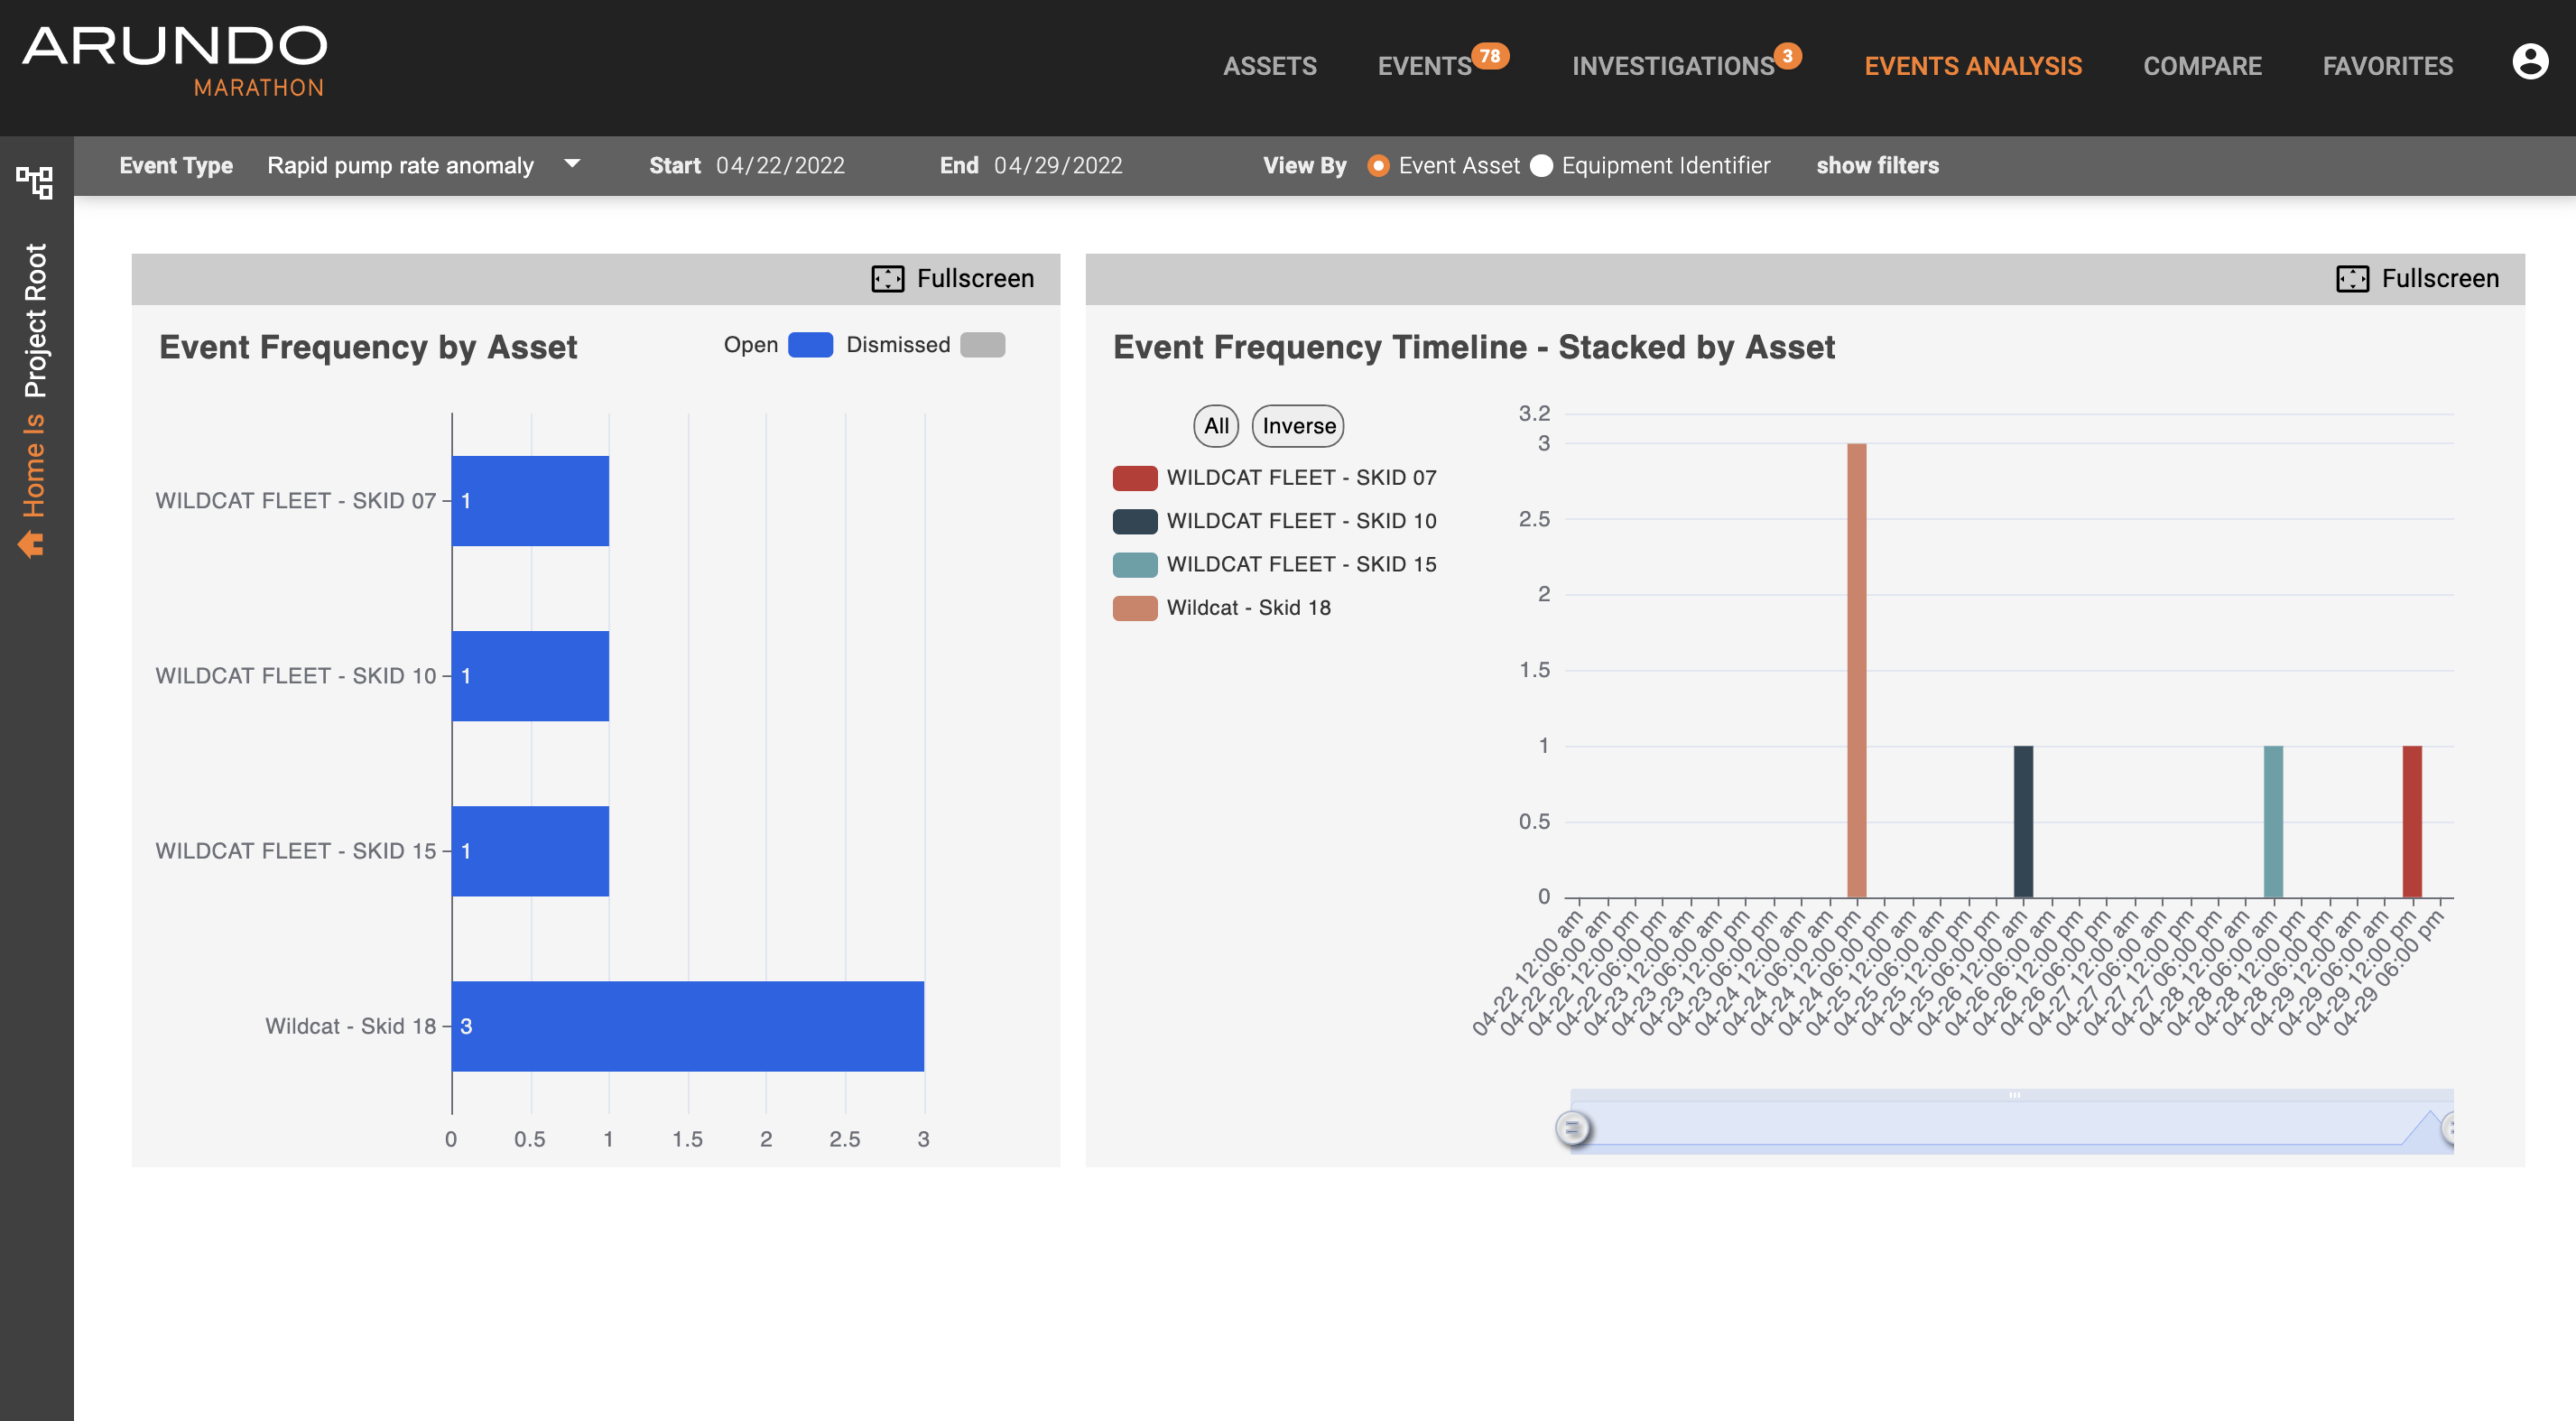
If you click on the Events tab, you will see a screen that looks similar to the one below:
Exploring Events Analysis
Here's how to explore Events Analysis:
- Access Marathon.
- Click Events Analysis on the Navigation bar.
- Select the Status of the events of interest (e.g. open, dismissed, all).
- Select the start date of the period you want to examine.
- Select the end date of the period you want to examine.
- Select the event type/KPI of interest.
- Scroll down and view frequency charts.
- Click assets on/off or utilize All/Inverse buttons, as needed.
More Detailed Information
The default setting when opening the Events Analysis tab is to show open events, as seen above. The default time frame is one week, ending on the current day (i.e. the previous week). You can change start and end dates simply by typing it in or by clicking on the calendar icon and selecting the appropriate date.
Below that bar are the specific event types, e.g. rapid pump rate anomaly, suction manifold pressure ratio anomaly, and discharge pressure rate anomaly. The event types are arranged in descending order, based on the number of events with your selected status in your selected period of time.
The event card of the event type that has the relatively darker grey shading is the event type selected. Regardless of severity, the event type with the greatest number of occurences will be selected by default. The two graphs that follow summarize events for this event type.
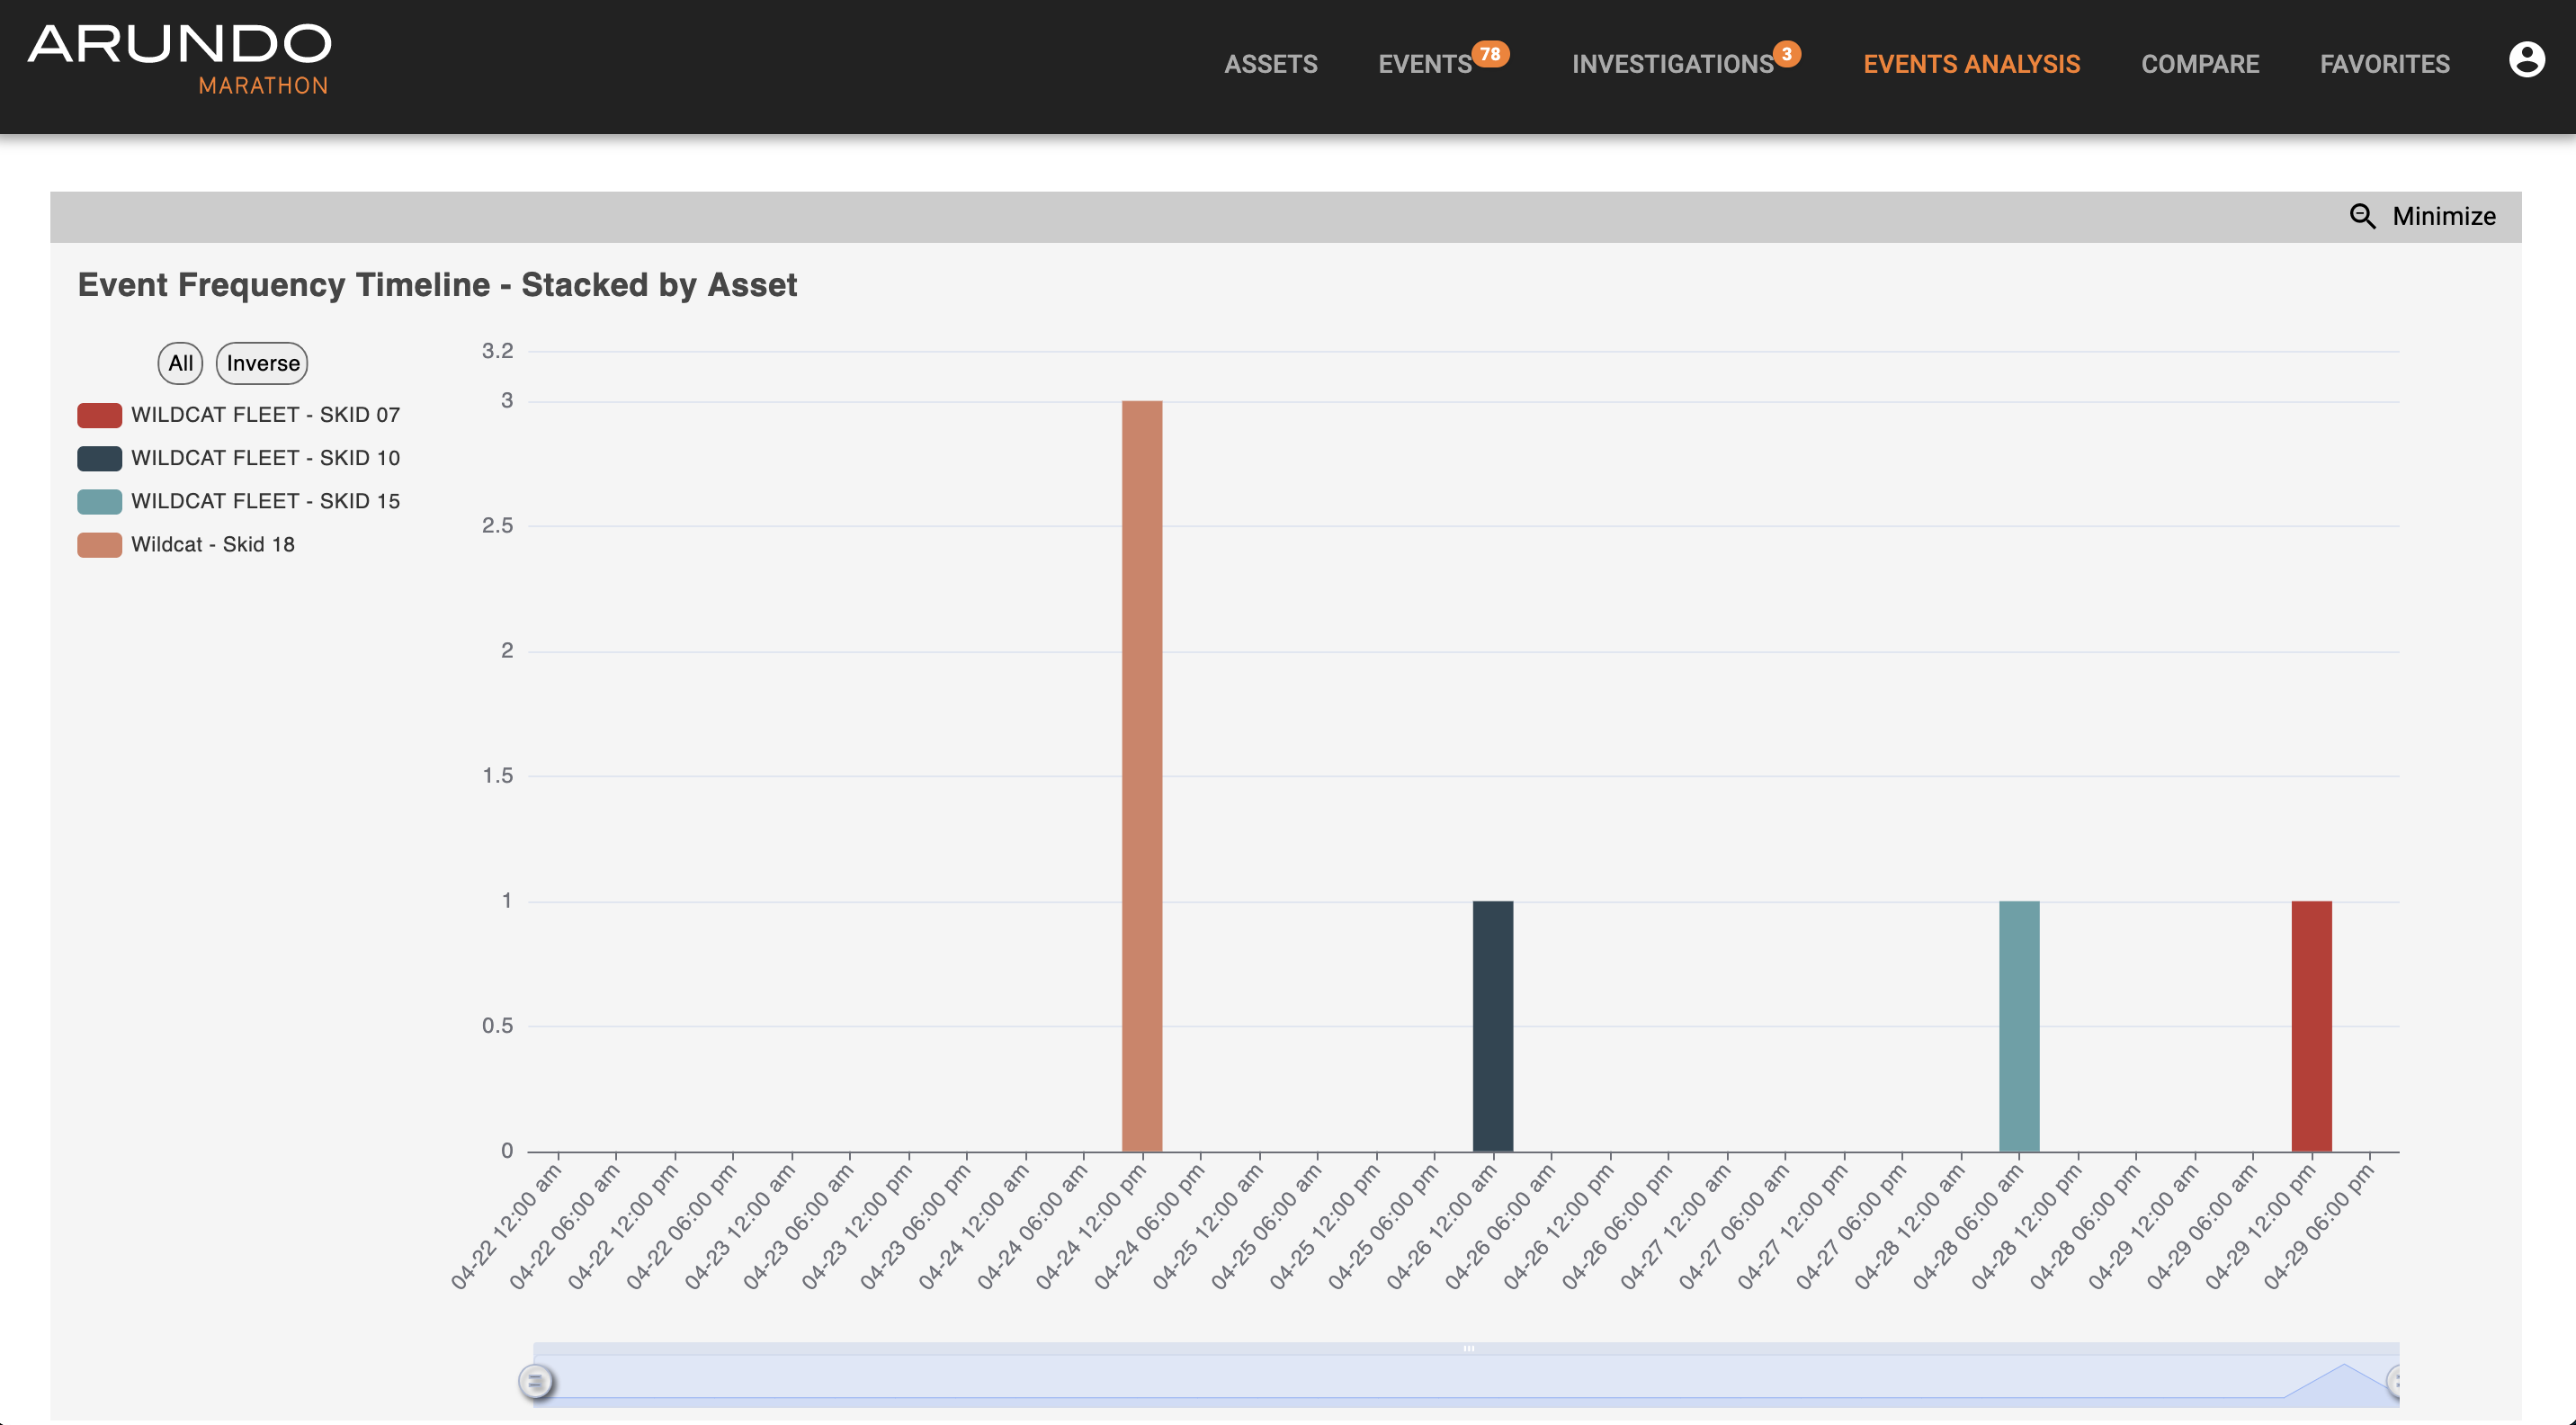
The first graph shows all assets that have the relevant event type in your specified period of time. The second graph shows when those events occured for each asset over the period of time selected. Both graphs allow a user to pop it out to full screen.
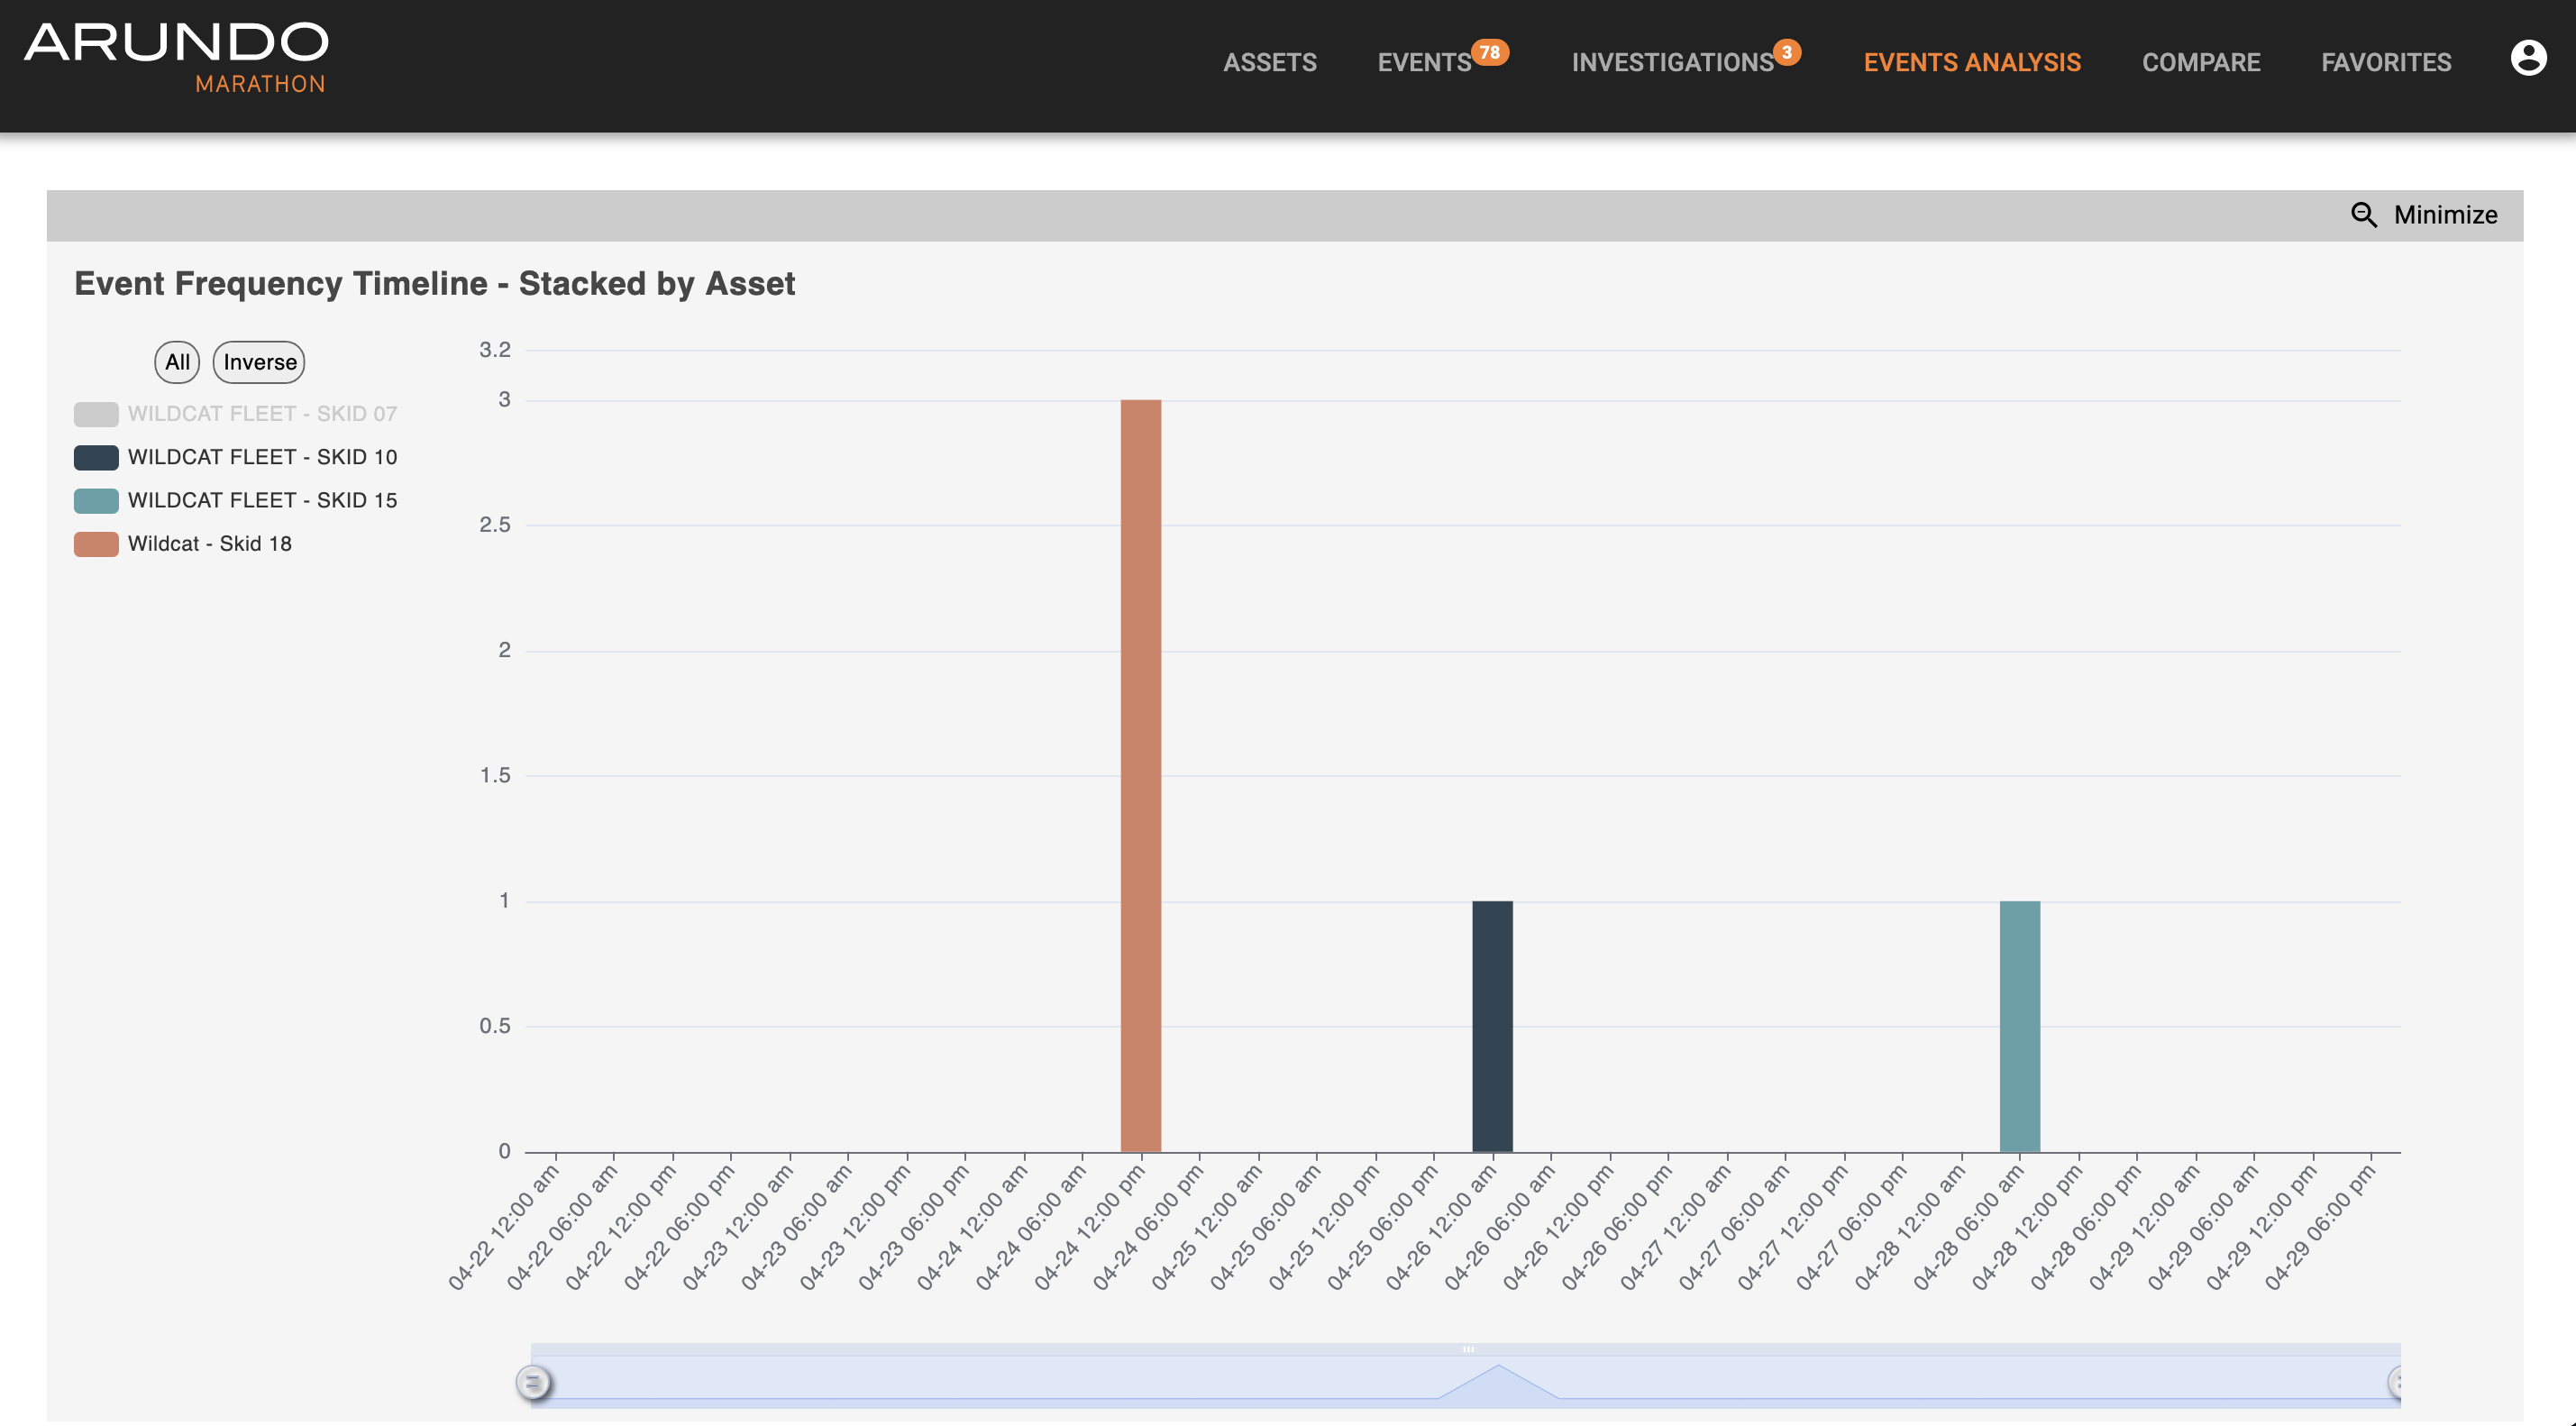
For the second graph, the legend appears to the left of the graph. Assets can be turned on/off simply by clicking on them. The All button shows all assets. The inverse button, flips on assets that are off and flips off assets that are on. For example, say you you would like look at Wildcat Fleet. Click on Fullscreen, it will enlarge as below:
Click on Wildcat Fleet - Skid 07. It will remove that tag from the graph, as below:
Then click on Inverse. It will turn all other asset tags off and turn Skid 07 back on, as below.
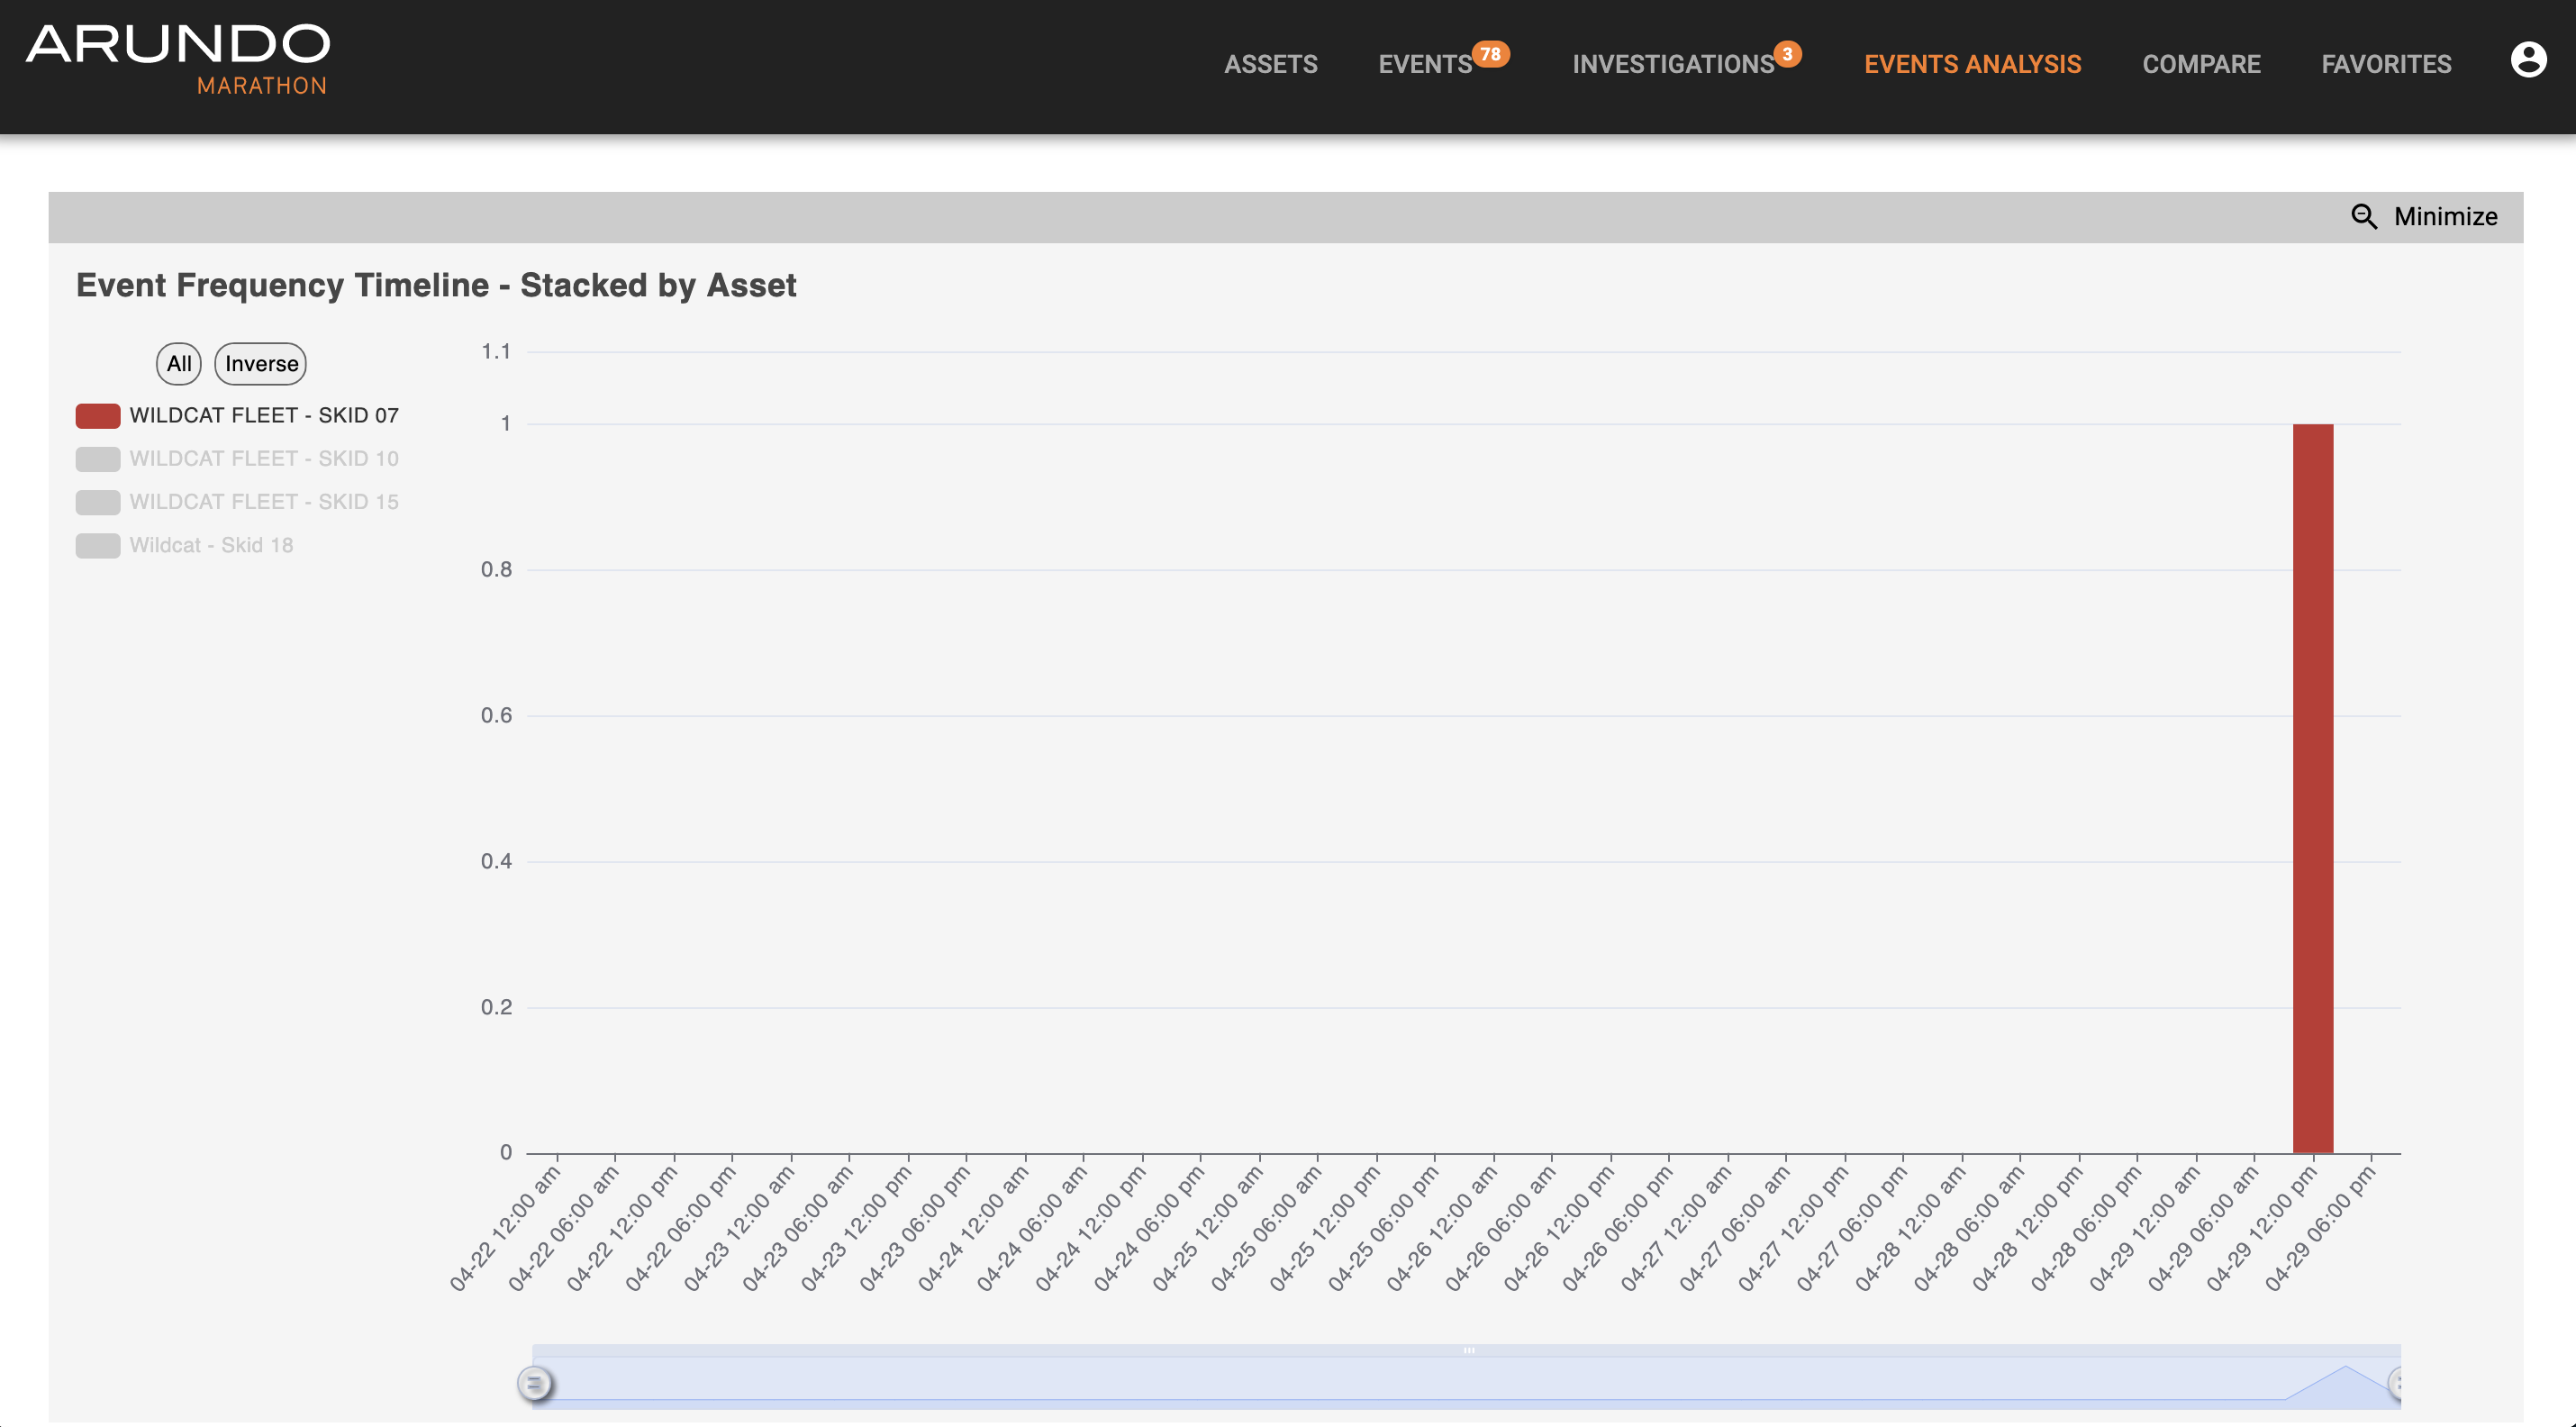
This is how the inverse button works. Note: you do not have to enter Fullscreen mode for this to work