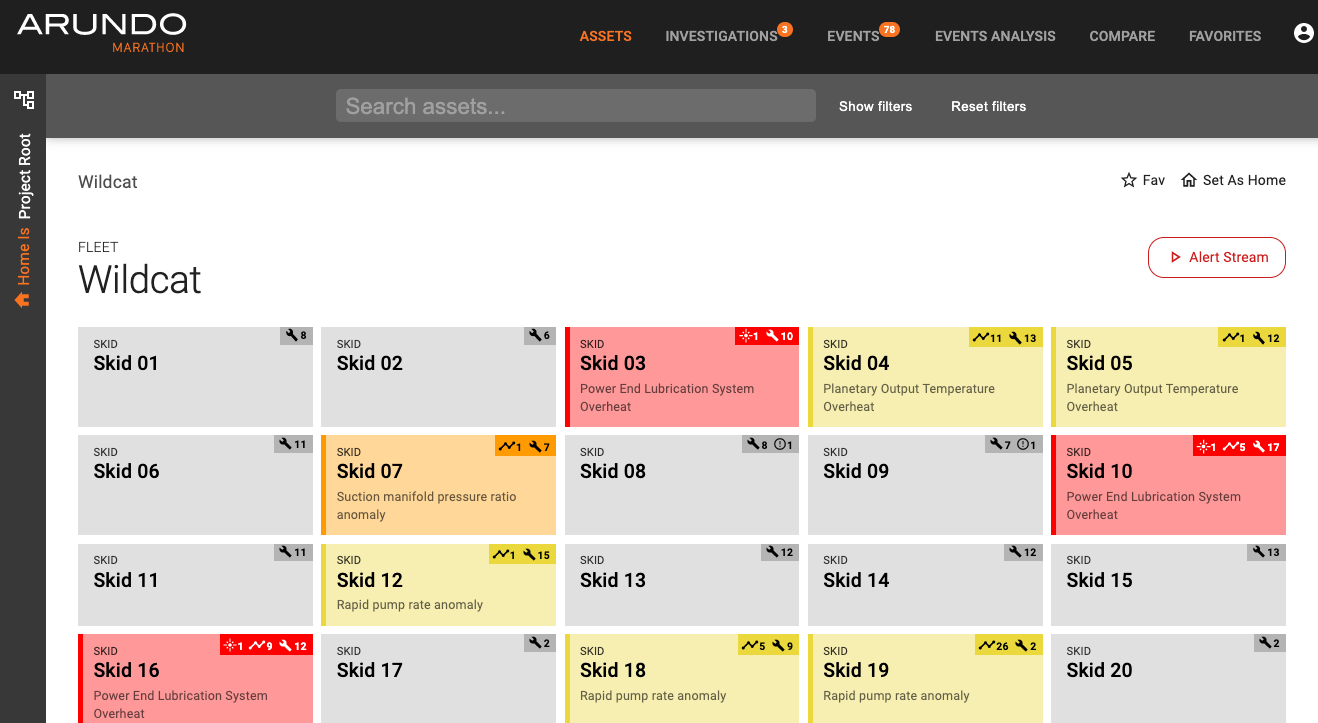
Assets

The Assets page displays visualizations of sensor data for the subsystems on your assets. Use this page to analyze and monitor performance of specific assets.
Searching for an Asset
Under Assets tab, you can use the search bar on the top of the page to search for specific assets. (Please note: You can only search for assets under the asset you set as home.)
You can use the following shortcuts to narrow your search:
- type: (only searches w/in type)
- name: (only searches w/in name)
- has:children
- is:tag (leaf node, data source identified as tag)
- has:events
You can also expand and use the filter to refine the content displayed on your screen. 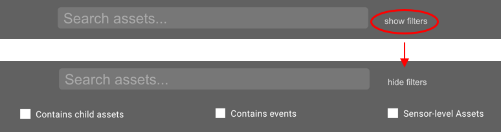
On the search result page, you can also multi-select assets and compare them.

Alert Stream

On an asset page, you will find the Alert Stream button on the top right. By clicking the button, Marathon starts streaming the latest investigations and prescriptive events within a top-level asset you are at, updating by minute. Events and investigations are sorted by observation time, and only active ones within the last 48 hours will remain in the list.

Asset cards with events or investigations that have not been opened by a user flash the color of the associated severity until the event/investigation has been viewed. Note: this is done on an individual basis and will not be altered by another colleague viewing the event (as long as it is still open). When there is an open (i.e., pending or in progress) investigation, the asset card color turns red.
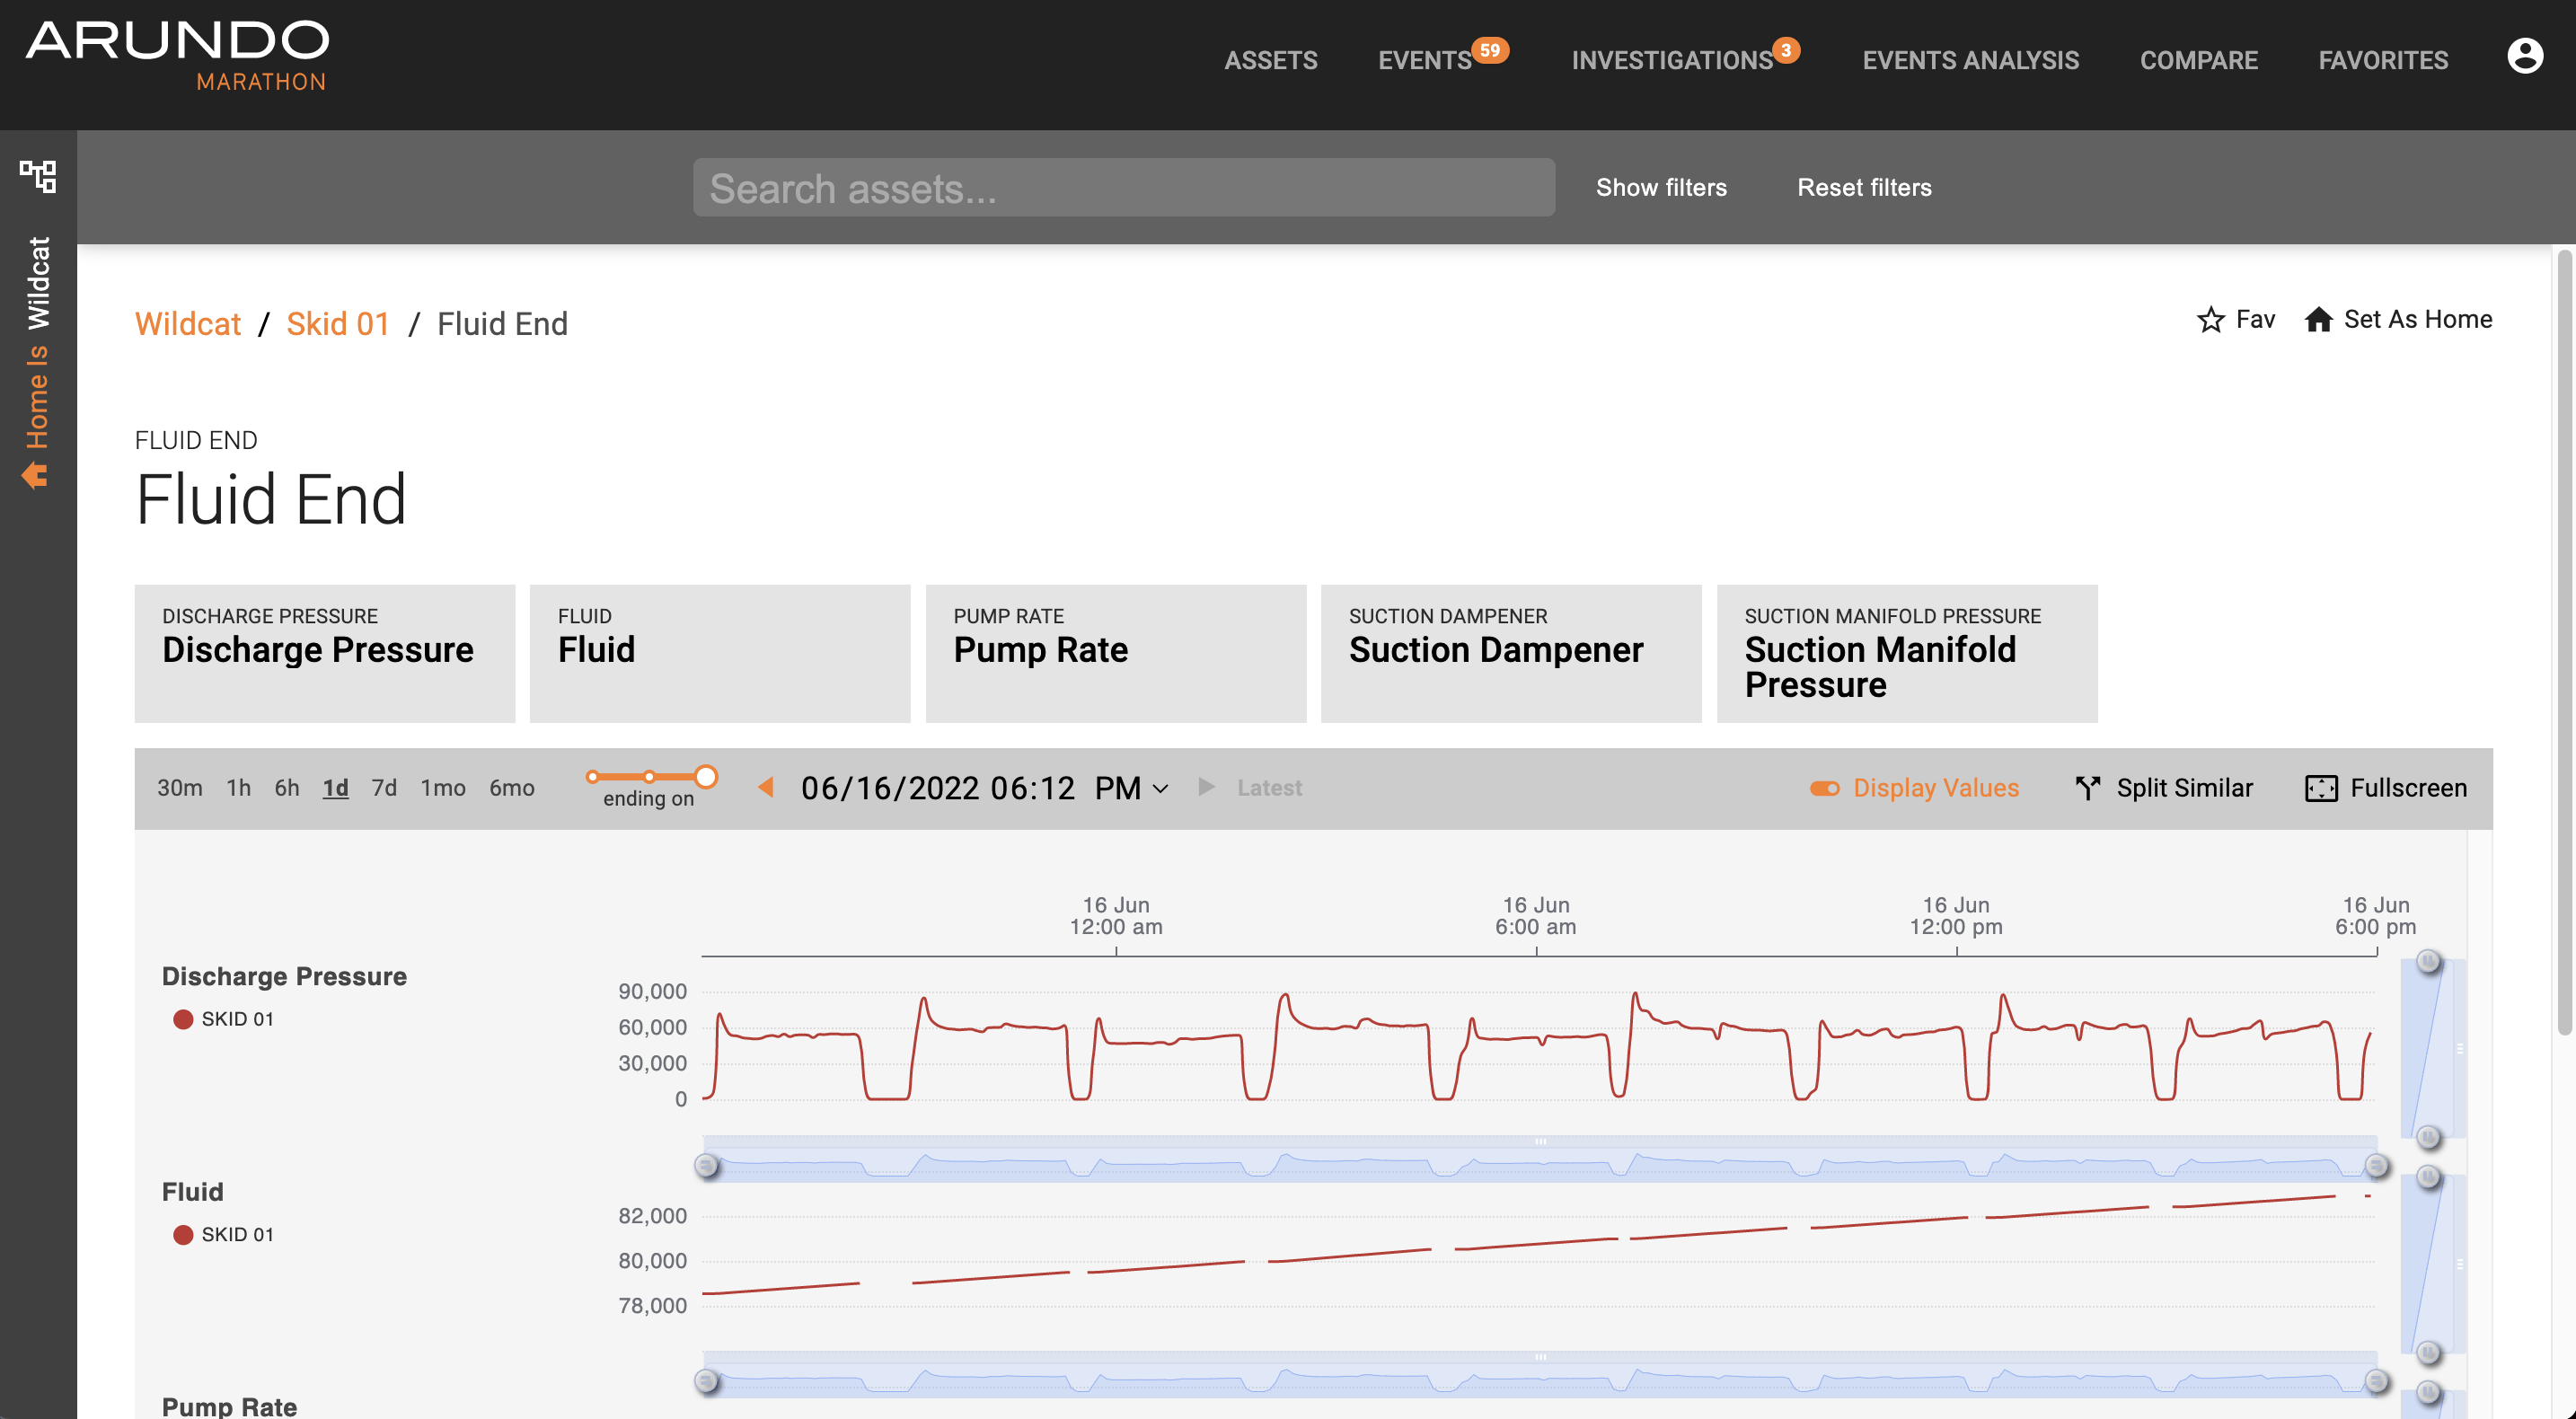
Asset Performance
You can view time-series graphs showing the sensor readings for assets. This allows you to monitor performance in near real time and also to review past performance.
Viewing Sensor Data
Here's how to view sensor data:
- Access Marathon.
- Click Assets on the Navigation bar.
- Use the left panel asset tree or main view asset cards to locate to a desired asset.
-
On the Display panel, select the subsystem or tag for which to view data.
A time-series graph for a specific period of time of your choice displays.
-
Analyze the data:
Please visit Navigating Time-Series Data page for more information.
Adding Favorites
You can add any time-series graphs for assets, sensors, or comparisons to your Favorites list, which can be accessed by going to the Favorites tab in the header. This makes is easier to display that data again in the future.
- Access Marathon.
- On the Display panel, select Fav above the graph.
- On the header, select the Favorites tab.
The graph displays in your Favorites list and is now available for quick selection when monitoring or comparing asset performance.
For more information, please visit Favorites page.